
Why do your ad platforms claim more orders than your store received
A US D2C jewelry brand received 6,640 orders last month; 6,360 after excluding draft orders created manually in the admin and in-store POS sales.
Meta claimed 3,940 of them. Google claimed 4,080.7. The email platform claimed 1,850. The creator program claimed 640.
Add them, and you get 10,510.7 claimed orders against 6,360 actual online orders. Every dashboard in the stack is confident, sourced, and internally consistent, and together they claim 65% more orders than the business actually served.
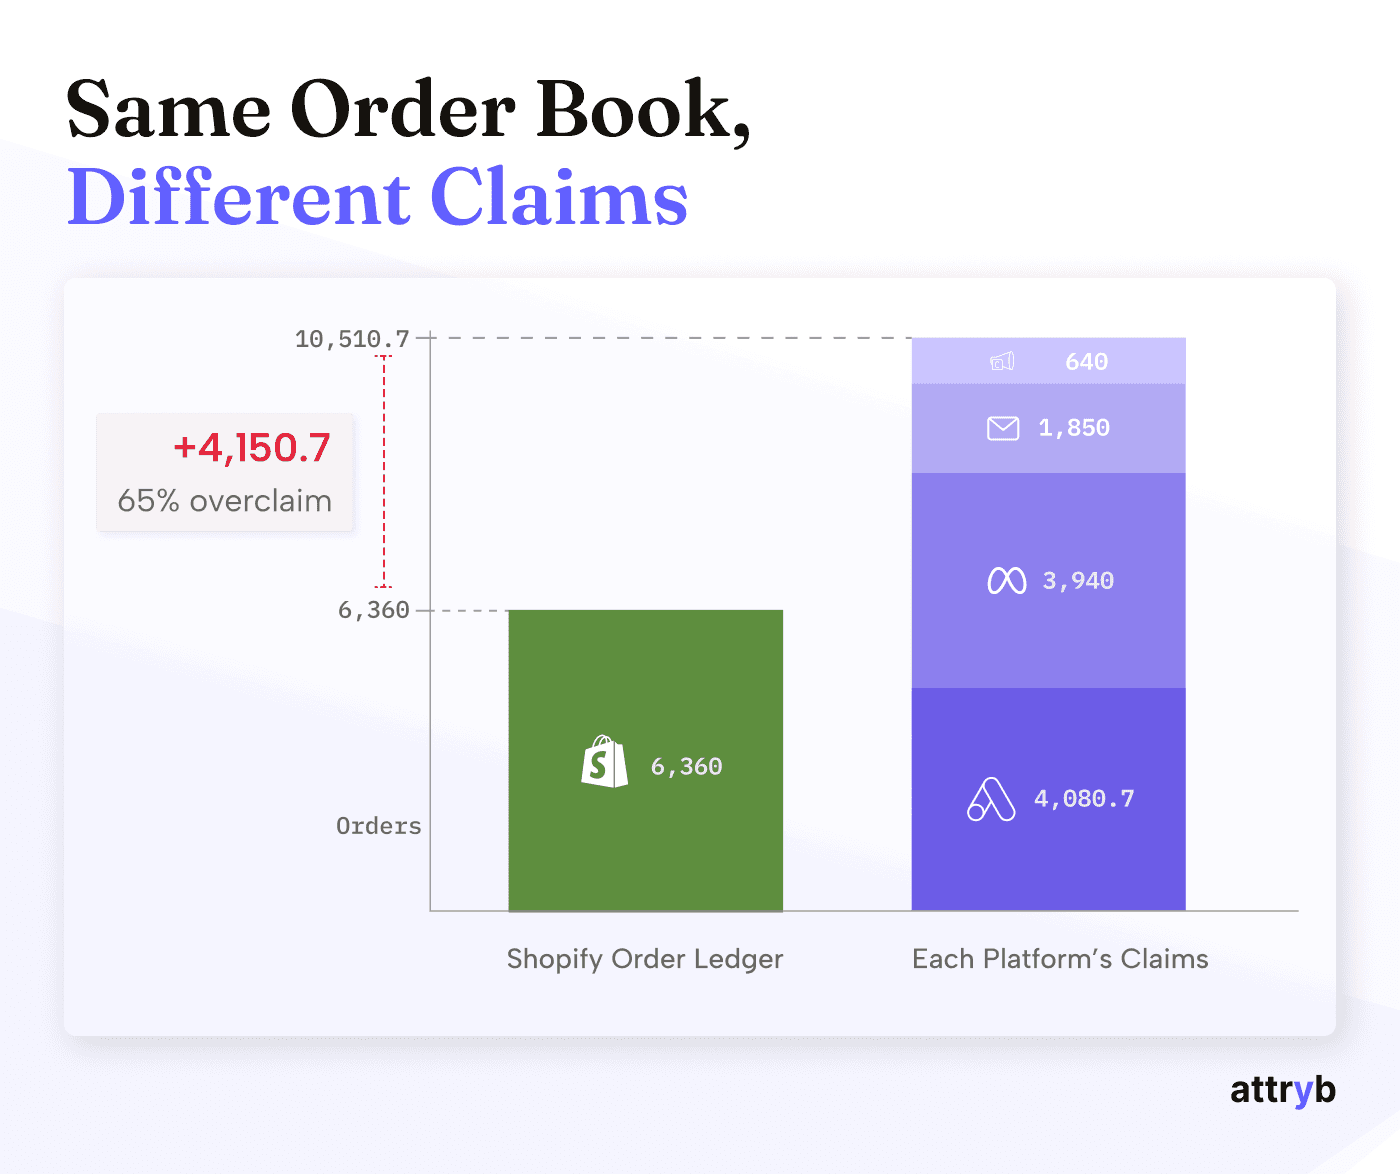
Figure 1. The difference in total orders claimed by ad platforms and the total orders in the Shopify ledger
This is not an issue of a bad setup. It happens to every store the moment it runs more than one channel, and it worsens with each channel added, because more channels mean more shared journeys, and every platform in a shared journey claims the whole order.
The practical question underneath it is not academic. A brand deciding where next month's budget goes needs to know each channel's contribution. Right now nobody in the stack can tell them, and every tool appears to be answering a different question.
The five checks at the end of this piece let you run the same test on your own store, mostly in under an hour. If they come back clean, none of what follows applies to you.
Why does every platform report a different number?
Each platform reports a different number because each one only sees interactions with its own touchpoints, measures them over its chosen window, and counts a unit it defines.
Claimed Orders | What it is counting | |
|---|---|---|
Meta | 3,940 | Purchase events, 7-day/28-day click + including 1-day view |
4,080.7 | Conversion actions, fractional across devices | |
Email platform | 1,850 | Orders following an open or a click |
Creator program | 640 | Coupon codes redeemed at checkout |
Total | 10,510.7 |
|
Meta knows who was served an ad and which of those people later bought. It cannot know whether the buyer clicked a Google Shopping ad two days earlier or had already visited four times from an organic Instagram post.
For any brand, only a small share of orders have a single channel in their journey; most involve several.
That produces a general rule:
Every platform's order number is inflated by some share of order journeys with platforms it cannot see, and no platform can tell you how large that share is.
Some of these shared journeys are closed by Meta. Others by Google, after the visitor came to the store from a Meta ad. Meta reports both identically, because from where it stands, the two look the same. No platform is lying. Each reports accurately on the fraction of the journey visible from where it stands.
Breakdown of Meta's Purchases
Figure | Value |
|---|---|
Total Purchases | 3,940 |
Purchases under 28-day click | 3,300 |
Purchases under 1-day view-through | 850 |
The purchases under 28-day clicks and 1-day view-throughs overlap, but the extent of the overlap is not clarified in the Meta dashboard.
Breakdown of Google's Purchases
Figure | Value |
|---|---|
Total Conversions | 4,080.7 |
Conversions under 30-day click | 4020.7 |
Conversions under 3-day engaged view | 40.5 |
Conversions under 1-day view | 20 |
Breakdown of Email Platform’s Purchases
Figure | Value |
|---|---|
Purchases reported under 7-day open or click | 1850 |
Breakdown of Creator Programs Purchases
Figure | Value |
|---|---|
Total Purchases | 640 |
Every platform picks a window that flatters it
Every platform decides how long after a touch it will keep claiming orders, and every platform picks a window that flatters it. Nobody harmonizes these.
Meta reports 1-day view, 7-day click, and 28-day click side by side. For this account, 3,300 purchases sat under 28-day click and 850 under 1-day view. The same order can appear in more than one. Nothing in the interface says which order, or how many windows.
Email platforms attribute orders placed within a 7-day window after an open or a click. Affiliate and creator platforms run their own last-click cookie for their own duration. Shopify runs a fixed 30-day window. An order placed 40 days after first contact falls within one platform's window but outside another's, resulting in different attributions for the same purchase for reasons unrelated to the customer's actions.
Nobody is counting orders
This is the part that makes the math in the opening both meaningless and alarming.
Google counts fractions of purchases. Cross-device journeys are apportioned in fractions across devices. That is why the total ends in 0.7. It isn't a rounding artifact but the honest arithmetic of a system that counts orders based on the impact Google touchpoints had on the journey.
Meta counts purchase events attributed to clicks and views. Of its 3,940 claimed orders, 850 are 1-day view-through conversions: shown an ad, didn't click, bought within twenty-four hours. Remove these, and the claim falls to 3,090. At the average order value of roughly $110 implied by Meta's own figures, the same $105,860 in ad spend now corresponds to about $340,000 in revenue, down from $434,400. Reported ROAS of 4.10 becomes 3.22 when measured on clicks alone.
Email platforms count orders following an open. An email open is a lower bar than a click and much lower than intent. A customer who opens a flow email on Tuesday, thinks about it, searches the brand on Thursday, and buys is an email-attributed order in the email marketing tool and an organic search order almost everywhere else.
Affiliate and creator platforms often count a coupon redemption at checkout, which inverts the funnel entirely. A customer arrives through paid search, chooses a product, reaches checkout, then opens a new tab to hunt for a discount code, finds a creator's code and applies it. The creator's platform records an acquisition. What actually happened is that an existing purchase decision leaked margin on its way out. For brands running code-based creator programs, this is not a marginal case; it is a substantial share of what those programs report.
Google's click volume makes the unit problem visible from another angle. 245,160 paid clicks produced 4,080.7 conversions, a rate of 1.7%. It shows that the ads account measures its own activity densely and the store's outcomes barely at all.
What does a working attribution system look like?
Before any diagnosis, we need to define what a working attribution system produces. The standard is simple, and almost nothing in the market meets it.
Each order carries one order's worth of credit. All of it gets allocated across the customer's journey. None of it twice.
That is MECE: mutually exclusive, collectively exhaustive. The credit for a single order can go entirely to one channel or be divided across several. What it cannot do is exceed one order or fall short of it. Across a month, the channel column sums to the order count.
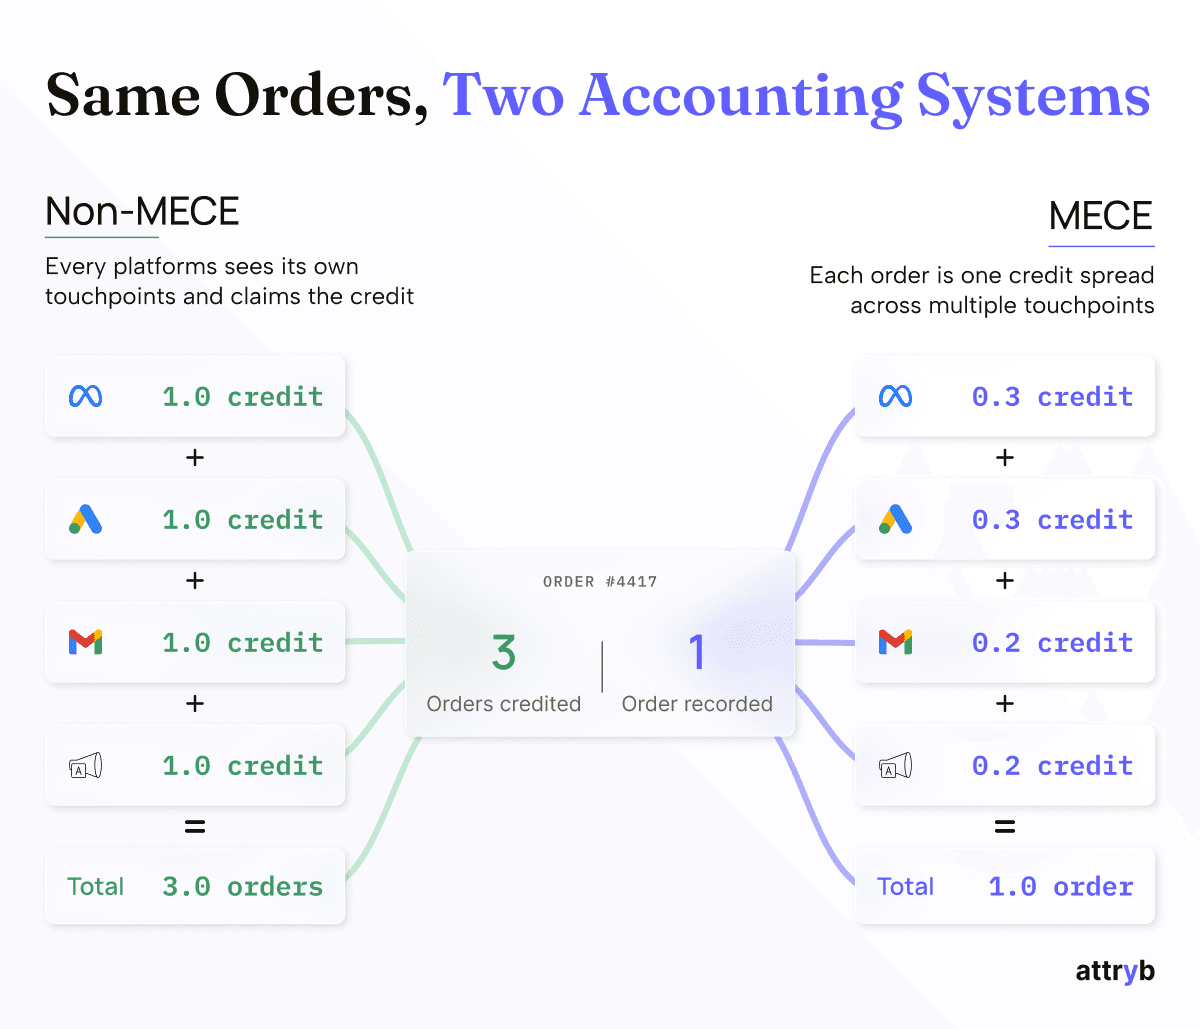
Figure 2. How the order count gets inflated without MECE
Every allocation decision a marketer makes depends on the totals reconciling.
Channel share
A share is a part of a whole, so the parts have to add up to the whole for the idea to mean anything. Divide each platform's claim by the total of 6,360 orders, and you get Google at 64%, Meta at 62%, email at 29%, and the creator program at 10%. Those four add up to 165%. They cannot all be right; nothing in any dashboard tells you which one to trim or by how much, and every budget split built on these percentages inherits the error.
Under MECE allocation, the total allocation across channels matches the Shopify ledger's total eligible orders. Platform dashboards can't produce this.True cost per acquisition
Meta's claimed CPA is spend divided by claimed orders. If the claim includes orders Google also claimed, the CPA is understated by the extent of the overlap, which is a figure nobody in the stack can produce.Comparison between channels
Two numbers can only be compared if the same rule produced them. Meta and Google do not share a rule, do not share a window, and are not even counting orders the same way.Error detection
MECE gives you one check on the integrity of your reporting: do the channel numbers add up to the order count in the ledger?
A total that must reconcile fails loudly when the pipeline breaks. Without it, you find out your pipeline is broken when a budget decision goes wrong.
Why can’t ad platforms fix attribution overlap?
The answer to the question is structural rather than technical.
A platform cannot discount for journeys it cannot observe. Meta would need to know what percentage of its claimed orders were shared, with whom, and how much of those shared orders occurred elsewhere. That information sits inside Google's systems and the email marketing platform, none of which Meta has access to, and none of which would be reliable if voluntarily supplied by a competitor for ad revenue.
Nor is there an incentive to try. Every ad platform is measured by advertisers on the return it appears to produce. A platform that unilaterally adopted stricter attribution would report worse performance than its competitors while delivering identical results, and lose budget for it. This isn't cynicism about their engineering; attribution generosity is a classic case of the Prisoner's Dilemma: unless every platform agrees to do it, any participant who defects will pay the penalty for their honesty.
There is also a boundary they cannot cross even in principle. Ad platforms report on media. Organic search, direct return visits, organic social, and word of mouth appear in no ad account, and for any brand, those channels also close a considerable share of sales. A system that only sees paid media cannot allocate an order book that is partly not paid media.
So the answer has to come from somewhere that sees every channel and has no stake in which one wins.
Why Shopify should have solved attribution overlap?
There is a strong argument that the store platform should be the natural owner of attribution. The reasoning is sound at first glance.
It sees every visitor, not one channel's worth. Every session on the store passes through Shopify regardless of where it came from - paid, organic, email, direct, affiliate. No ad platform has this view, and none ever will.
It holds the denominator. Shopify owns the order ledger. It knows exactly how many orders were placed, what they were worth, and which were drafts. Every other system in the stack is estimating a number Shopify holds as fact.
It holds the strongest identity signal anyone has. Customers log in, subscribe, and leave an email address at checkout. That does not, by itself, link a shopper's phone browsing to her laptop purchase, which is the hard part of the problem. But it is still a better starting point than any other party in the stack has, and it sits unused for attribution purposes.
It has no stake in the outcome. Shopify does not sell media. It has no reason to prefer Meta over Google, or paid over organic. It is the only party in the stack with both the data and the neutrality to arbitrate, which is exactly what attribution requires.
It already ships the attribution models. The hard analytical layers of first click, last click, last non-direct, linear, and any-touch are all in the product today.
It has the scale to be right. Millions of stores, billions of sessions, and the ability to learn classification patterns no individual merchant could.
Every precondition is in place. A merchant paying for the Shopify system to record their revenue should be able to ask that system which channel produced it, and this should have been solved years ago by the platform holding all the pieces of the puzzle.
Why does Shopify’s built-in attribution miss two-thirds of your traffic?
Because of how Shopify classifies a visit.
Shopify reads only two signals, and both are disappearing
Shopify identifies a channel using two things: the UTM parameters in the landing page URL and the referring domain.
If those give a clear answer, the session gets that channel. If they don't, it goes to Unknown. If the referrer is empty, it goes to Direct.
The way the Direct channel is attributed causes most of the damage.
A referrer is a line the browser optionally sends, naming the page the visitor came from. When it's missing, all Shopify knows is that the browser didn't say anything. It reads that silence as "this person typed the URL or used a bookmark."
Usually that's wrong. The visitor came from somewhere specific. The browser just didn't mention it.
Where does the signal actually go missing?
There are six common points between the click and the report where the source drains out. Most stores are losing traffic at four or five of them at once.
In-app browsers
Links opened inside Instagram, TikTok, WhatsApp, or Gmail run in the app's own browser. Many of them strip the referrer before the page loads. The customer came from social. Shopify sees nothing and files it as Direct.Apple's link-tracking protection
Apple removes known tracking parameters from links opened in Mail, Messages, and private browsing. Your UTM tag was on the link when you sent it. It isn't there when the page loads.Safari and browser privacy limits
Safari's tracking prevention shortens the lifespan of browser cookies, especially when someone arrives from an ad link. A visitor who returns two weeks later looks like a brand new person with no history.Redirect chains and link shorteners
Every extra hop between the ad and your store is a chance to lose the query string. Vanity URLs, shorteners, and old HTTP-to-HTTPS redirects all silently drop parameters. The customer lands fine. The tag is gone.Ads built without UTM tags
Meta campaigns built in Ads Manager often lack UTM parameters. The click arrives with anfbclidinstead. That parameter identifies the ad exactly, and Shopify's reporting doesn't read it.Ad blockers and consent tools
Blockers strip campaign parameters before the page loads. Consent banners can block tracking until the visitor clicks accept, by which point the arrival is already recorded.
None of these change how customers found you. They change what Shopify can see.
Bucket | Sessions | Share |
|---|---|---|
Direct | 419,900 | 36% |
Unknown/unresolved | 314,530 | 27% |
Paid, named | 314,970 | 27% |
Organic, named | 110,310 | 10% |
Total | 1,159,710 |
Add the first two rows. 734,430 sessions, 63% of all traffic, with no channel a marketer can use.

Figure 3. Session split based on Shopify's attribution
For two out of every three visits, Shopify has no answer to the question "Where did this person come from?"
That means no way to value the visit, no way to credit a sale to it, no way to build a segment from it, and no way to defend it in a budget meeting.
And it gets worse every year. The main input is the query string, and it is being cleaned up by everyone at once. A brand that tags every campaign perfectly today will have a worse Shopify report next year, even though it did nothing wrong.
The 30-day window cuts off a third of the order book
Shopify's attribution looks back 30 days. Any touch older than that gets no credit under any model.
At this store, 34% of orders had a first touch more than 30 days old. The average journey ran 64 days.
A window doesn't shorten a journey. It cuts it off, and then reports on what's left.
So for a third of the order book, the channel that introduced the customer isn't undercredited. It's absent. It falls outside the window before any model runs.
And that third is the expensive part. Long journeys mean more research, more comparison, higher price. These are exactly the orders where knowing the origin is worth most.
A 30-day window is generous for a $19 impulse buy. It's meaningless for a $900 ring. One default can't be right for both, and merchants inherit it without ever seeing their own journey length.
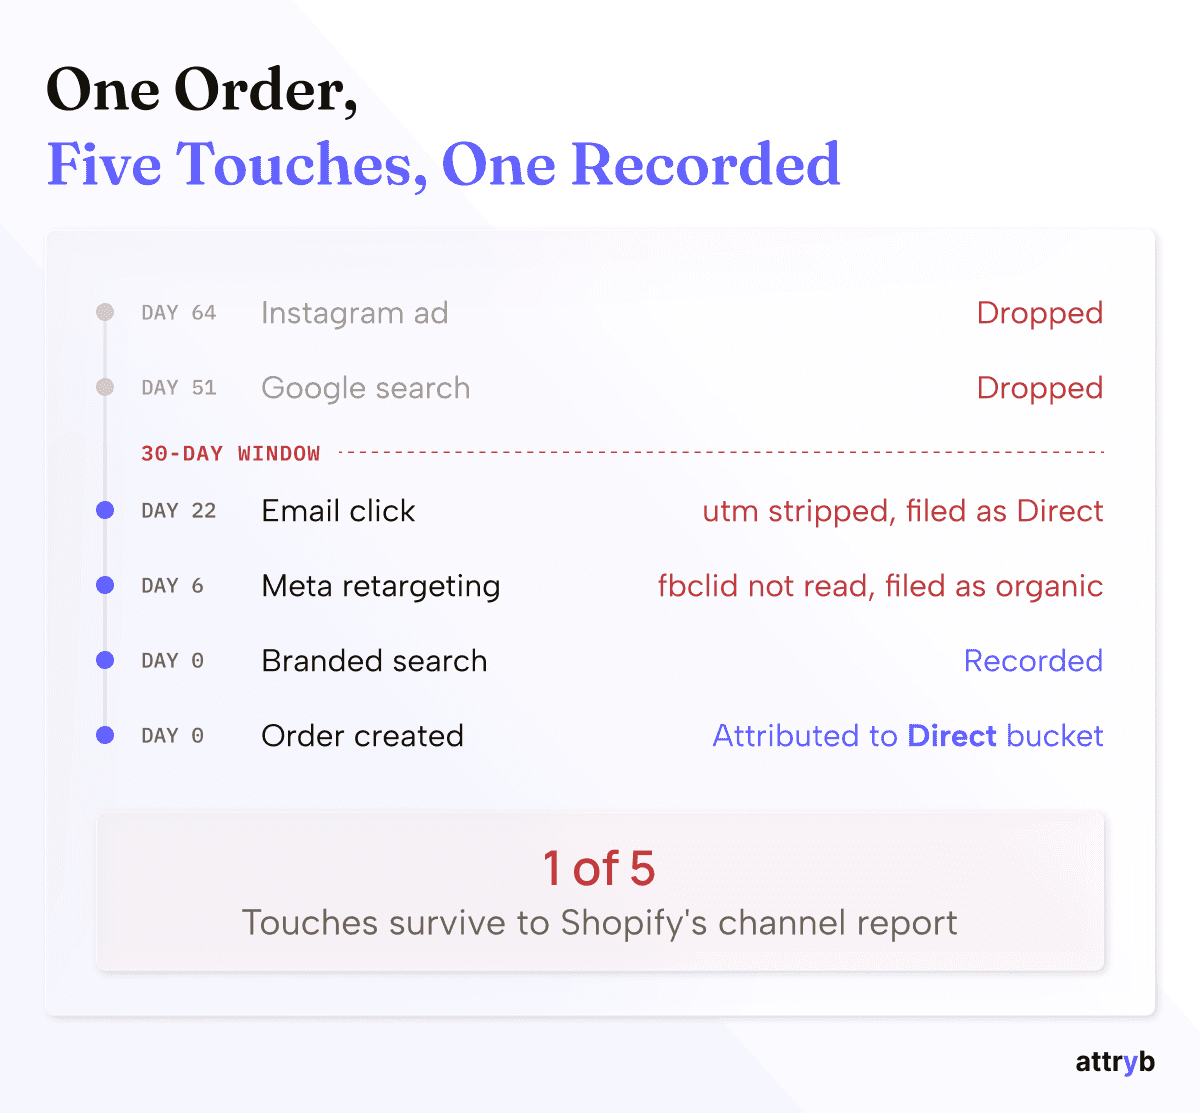
Figure 4. Where Shopify looses the attribution signals
Five attribution models can’t fix incomplete attribution
This is the failure most people misdiagnose.
Shopify offers first click, last click, last non-direct, linear, and any touch. The usual advice in this category is to move beyond last click and adopt multi-touch.
Shopify merchants can already do that. Doing it changes almost nothing.
An attribution model is a rule for splitting credit across the touchpoints in a journey. Every rule works on a list of touchpoints that already have channel names attached.
No model can give credit to a channel that isn't on the list. And no model can do anything with a touchpoint marked Unknown except pass it through as Unknown.
When 63% of sessions have no usable channel, all five models are blind to the same 63%.
The first and last clicks will disagree with each other. Both will be wrong in the same direction, about the same two-thirds of the traffic.
You can spend a week comparing models and land on something that feels like an insight. What you've actually learned is a fact about the third of sessions Shopify could name, presented as a fact about your business.
Classification comes before modeling. Get the channel names right and model choice becomes a real question. Get them wrong, and model choice is theatre.
Why hasn’t Shopify fixed it?
Shopify's classification was built for a simpler web, when a referrer and a UTM tag were enough. It hasn't been rebuilt as those signals eroded.
That's a product priority, not a capability gap. Shopify makes its money from checkout, payments, and the merchant relationship. Attribution reporting is a supporting feature, and supporting features get maintained rather than reinvented.
There's a harder reason too.
Doing this properly means reading every event, choosing between conflicting signals, joining sessions across devices, and then taking a position on whether Meta's or Google's claim is right.
That last part means refereeing between the two largest advertising businesses on earth, on behalf of merchants, for free. It's a fight with no revenue attached.
So the gap stays open. Shopify knows exactly what you sold and can't tell you where it came from. The ad platforms have opinions about where it came from, and none of them know what you sold.
Nothing in the default stack has both.
How Does Attryb Solve the Attribution Problem?
The job is to supply the inputs Shopify lacks without giving up the denominator it has.
That second half is where the arithmetic in this piece comes from: we do not build a parallel order book. We read the store's own order ledger from Shopify - the same 6,640 orders, the same 6,360 eligible - and attach a classification and journey layer to it. Shopify remains the source of truth for what sold. What changes is the answer to where it came from.
Five mechanisms do the work. The first is easier to show than to describe.
A worked example: A visitor arrives from an Instagram ad placement. The referring domain says instagram.com. The URL carries no UTM tag, because the campaign was built in Ads Manager without one. It does carry an fbclid parameter, which Meta appended at click time.
Shopify reads the referrer, sees Instagram, and files the session as organic Instagram.
We read the fbclid, recognize a paid Meta click, and classify it as Meta Ads.
The same visitor from the same ad shows as two different source channels in two reports. Multiply it over a month, and it yields the largest disagreement in the model comparison below: Meta Ads produces 800 first-click orders in our numbers, compared to 120 in Shopify's. The traffic was never missing. It was filed under a neighboring name, in a report that looked complete.
Classify events, not sessions
Shopify's unit of classification is the session, typed from how it started. We classify each event independently against the full signal set:
UTM parameters, the same input Shopify uses, when present.
Click identifiers -
gclid,fbclid,ttclid,msclkidand equivalents, appended by the platform at click time rather than by the marketer, so they survive when a hand-built tag doesn'tQuery strings beyond the standard set, including custom campaign parameters.
Referrer host and subdomain, which distinguishes l.instagram.com from instagram.com.
A store-domain check, so internal navigation isn't mistaken for an external referral.
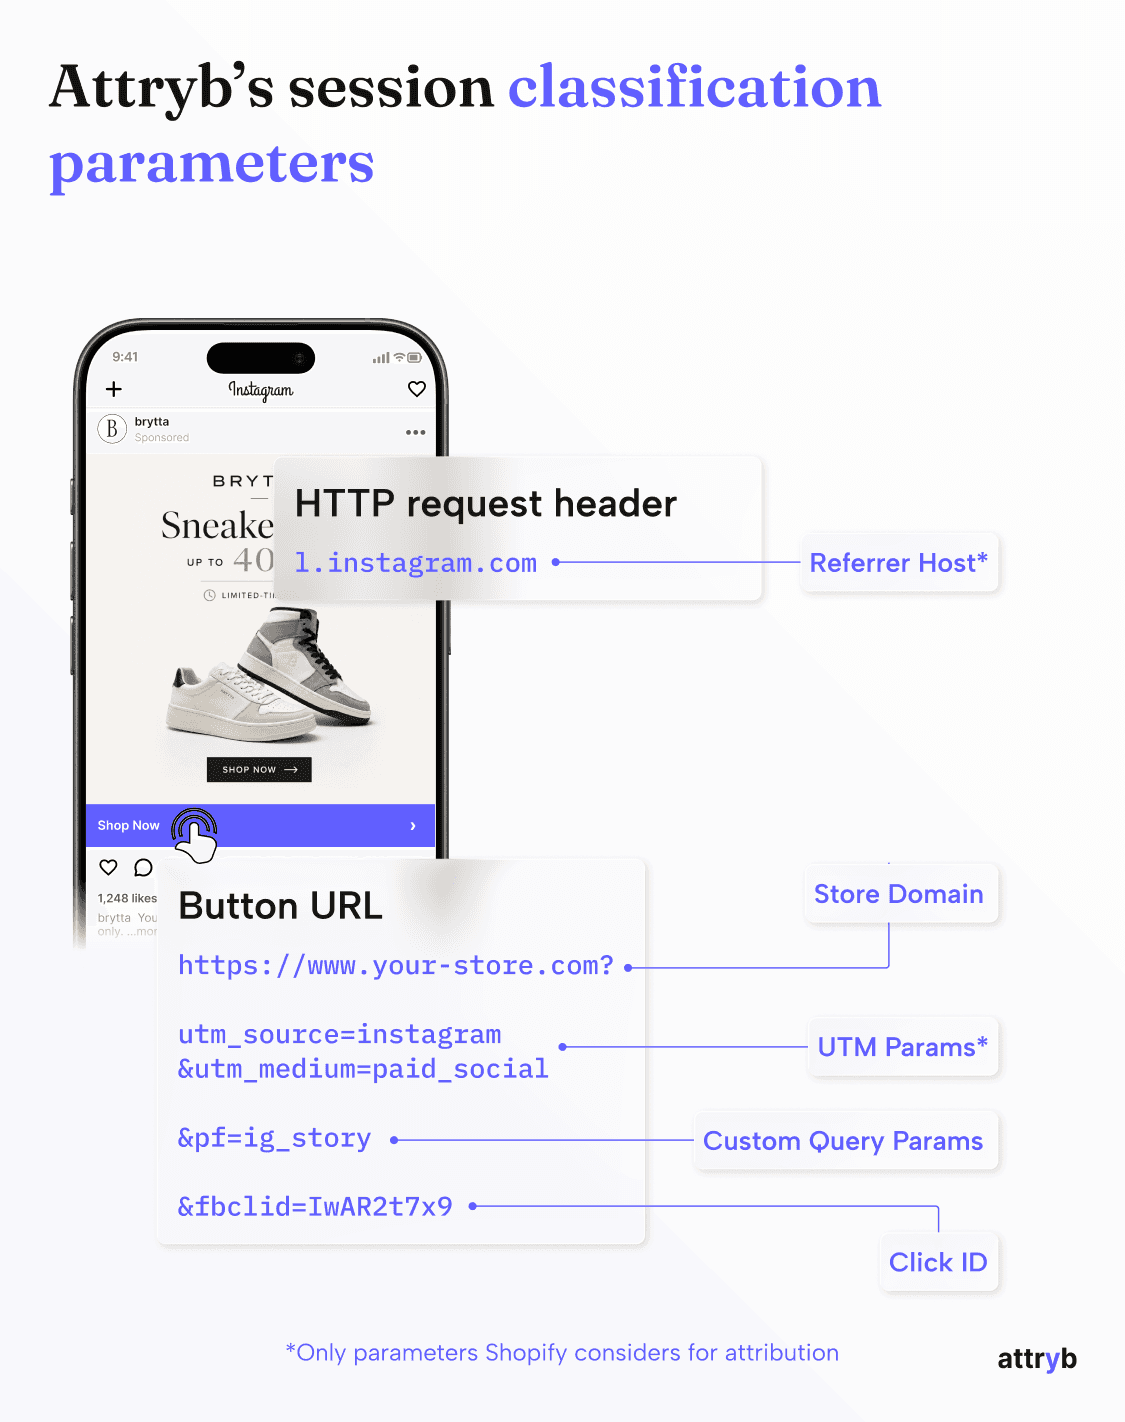
Figure 4. Attryb's session classification parameters
Resolve conflicts by precedence
Sessions frequently carry signals that disagree - gclid on the URL and a social referrer in the header. When paid and organic signals appear together, paid intent takes precedence, because a click identifier is a more specific claim than a referrer. The platform issues it at the moment of the click, thereby identifying a particular ad interaction. A referrer only reports which page the browser came from, which might be a share, a redirect, or a preview.
That rule accounts for a large share of the 177,430 sessions a month that move out of Unknown into named paid channels.
Build the session from its events
Because each event has its own classification, a session's channel is derived from the events within it rather than assumed from how it opened. Direct is assigned only when no event anywhere in the session offers a stronger signal.
That change moves 150,630 sessions per month out of Direct, reducing the total from 419,900 to 269,270. When combined with event-level classification, unresolved sessions drop from 314,530 to 2,330, accounting for 0.2% of traffic.
The 2,330 are overwhelmingly first-ever visits arriving with no referrer, no parameters, and no prior device history: a link opened inside an app that strips everything, or a browser configured to send nothing. Any vendor quoting zero here is describing a system that guesses.
Assemble the journey across devices
Classification tells you where one visit came from. Attribution requires every visit from the same person, in order, ending with a purchase.
A realistic journey for this brand: an Instagram ad on a phone seen during a commute, two return visits that week from Google search, an email opened three weeks later on a work laptop, and a branded search on the laptop two weeks after that ending in checkout. Five sessions, two devices, three channels, forty days. A system that can't join them reports a single-touch purchase from branded search.
Joining relies on a hierarchy.
Strongest is explicit identification - a login, a subscription, a completed checkout - which makes every session on that device attributable to a known customer and joins earlier anonymous activity retroactively.
Next is a first-party identifier persisted on the device, which holds sessions together over time and makes a 64-day journey observable at all.
Weakest, used to strengthen a link rather than create one, are contextual signals: a click identifier reappearing, an email link carrying a recipient parameter.
Tie every credit to an order ID
Attribution resolves to the order, not to a conversion action, a pixel event, or a probabilistic match. Each credited touchpoint is a real session with a real timestamp joined to a specific order in the ledger.
Against the MECE standard, first-click, last-click, last-non-direct, and linear each allocate all 6,360 eligible orders exactly once to a channel/source. Any-touch exceeds the total by design and says so.
Order reconciliation only sets the bar; it doesn't say anything about whether the credit landed on the correct channels. A report crediting 7,400 orders against 6,360 actual is double-counting, and nothing in it should be trusted until that is found. Clearing the bar doesn't make a system accurate. A system crediting all 6,360 orders to Direct would reconcile perfectly and tell you nothing.
Of every dashboard in the stack, exactly one is built to tie out.
Attryb vs Shopify: What Do 5 Attribution Models Show?
Both systems use a 30-day window here, which matches Shopify's fixed window, so the comparison is fair. Attryb’s default is the full journey, which produces larger numbers for long-consideration channels. Thus, the 30-day window is the conservative version.
One thing to watch across all five tables: Attryb's total is 6,360 every time. Shopify's total changes depending on which model you pick and never matches the order count.
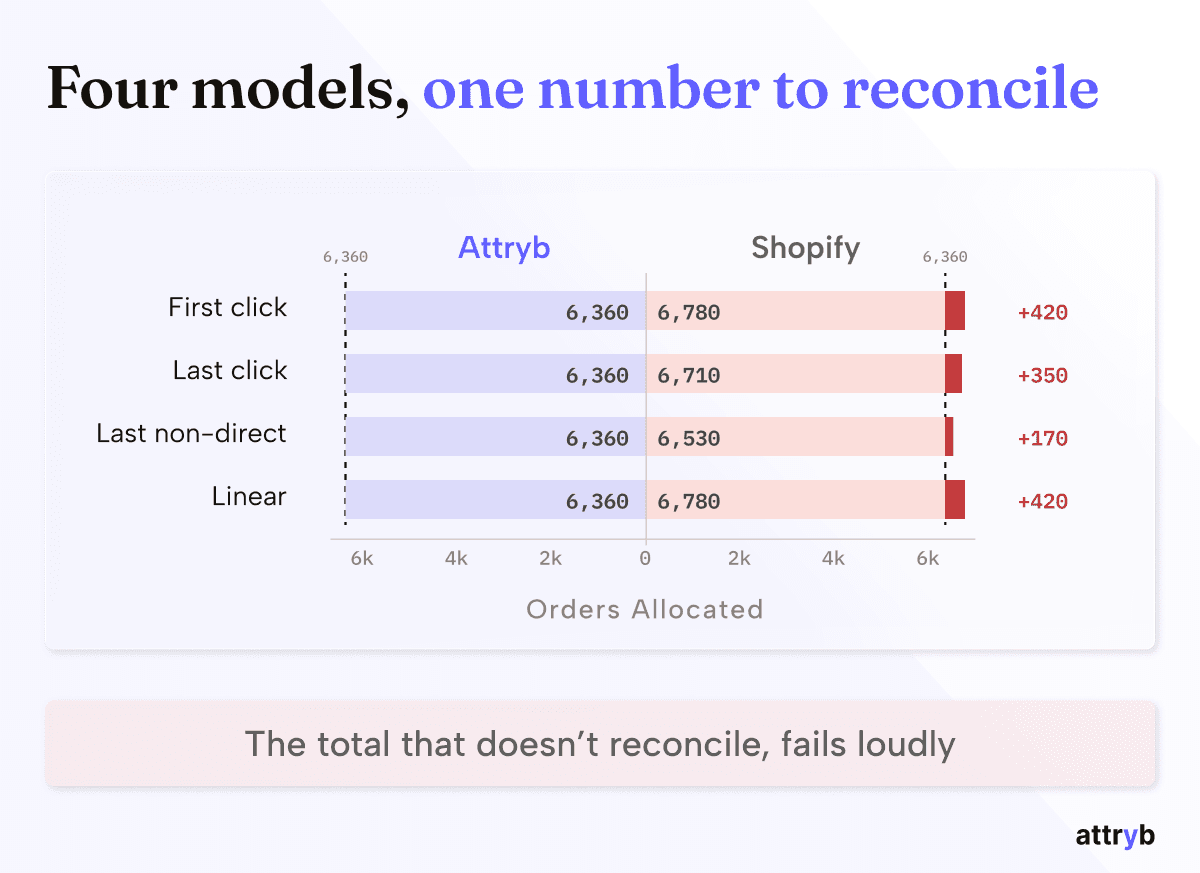
Figure 5. Attryb's order attribution always reconciles
First click: which channels introduce customers
Channel | Type | Attryb | Shopify |
|---|---|---|---|
Direct | Unattributed | 970 | 1,470 |
Google Ads | Paid | 1,880 | 2,130 |
Google Search | Organic | 860 | 700 |
Meta Ads | Paid | 800 | 120 |
Meta organic | Organic | 980 | 1,670 |
Paid | 680 | 630 | |
Creator program | Partner | 190 | 60 |
Total |
| 6,360 | 6,780 |
Look at the two Meta rows together. Attryb credits paid Meta with 800 introductions and organic Meta with 980. Shopify credits paid: 120; organic: 1,670.
The family totals are almost identical: 1,780 against 1,790. The split is completely different.
That is the failure mode worth understanding. The traffic is not missing from Shopify. It arrives without a UTM tag, carrying only an fbclid, which Shopify's reporting doesn't read. So a paid click through an Instagram placement gets filed as organic Instagram.
A brand reading Shopify's numbers doesn't see a hole and go looking. It sees a complete report saying paid Meta introduced 120 customers and organic Meta introduced 1,670, and it moves budget from ads into content.
Direct shows the same pattern at the whole-account level. Shopify puts 1,470 first touches there; Attryb, 970.
Last click: which channels close the sale
Channel | Type | Attryb | Shopify |
|---|---|---|---|
Direct | Unattributed | 1,140 | 2,250 |
Google Ads | Paid | 1,220 | 1,500 |
Google Search | Organic | 1,390 | 420 |
Meta Ads | Paid | 720 | 140 |
Meta organic | Organic | 1,100 | 1,510 |
Paid | 700 | 850 | |
Creator program | Partner | 90 | 40 |
Total |
| 6,360 | 6,710 |
Compare the Google rows against the first-click table, and you get the most actionable finding in this piece.
Google Ads: 1,880 first touches, 1,220 last. It introduces roughly a third more customers than it finishes.
Google Search: 860 first touches, 1,390 last. It does the reverse.
Paid search brings people in. Organic search converts them weeks later. Judged only on last click, which is what Google Ads reports, paid search looks like a moderate performer. Judged across the journey, it is the largest source of new customers in the business, and cutting it damages the organic number downstream.
Shopify cannot show you this. It credits organic search with 420 orders, compared to Attryb's 1,390, because most organic sessions arrive untagged and land in Direct.
Which is why Shopify's answer to "what closes your sales" is Direct, at 2,250. That is not something a team can act on.
The creator program does what partner channels usually do: 190 first touches, 90 last. It opens journeys and rarely finishes them.
Last non-direct click: Shopify correcting itself
Channel | Type | Attryb | Shopify |
|---|---|---|---|
Direct | Unattributed | 680 | 560 |
Google Ads | Paid | 1,340 | 2,220 |
Google Search | Organic | 1,440 | 620 |
Meta Ads | Paid | 820 | 210 |
Meta organic | Organic | 1,080 | 1,760 |
Paid | 900 | 1,090 | |
Creator program | Partner | 100 | 70 |
Total |
| 6,360 | 6,530 |
This model is Shopify disagreeing with itself.
Its Direct number falls from 2,250 on last click to 560 here. Told to look past Direct, Shopify finds that three-quarters of it was never direct.
That is the platform admitting, in its own interface, that its default overstates.
Watch where the credit goes. Shopify's Google Ads rises from 1,500 to 2,220 because skipping Direct pushes the order back to the last-named touch, which is usually paid. Meta organic rises too, from 1,510 to 1,760.
Attryb's numbers move far less between the two models, because there was less misfiled Direct to skip in the first place.
Linear: credit spread evenly across the journey
Channel | Type | Attryb | Shopify |
|---|---|---|---|
Direct | Unattributed | 1,890 | 1,960 |
Google Ads | Paid | 1,030 | 1,780 |
Google Search | Organic | 1,370 | 490 |
Meta Ads | Paid | 620 | 160 |
Meta organic | Organic | 840 | 1,660 |
Paid | 540 | 680 | |
Creator program | Partner | 70 | 50 |
Total |
| 6,360 | 6,530 |
Here, the two systems almost agree on Direct: 1,890 against 1,960.
That cuts against everything above, so it is worth explaining rather than skipping.
Linear counts how often a channel appears in a journey, not whether it started or finished one. Direct does appear in plenty of journeys, because people genuinely return to a site without a referrer partway through a long consideration period. That is real behavior, not a classification failure.
So the honest claim is narrower than "we have less Direct." Direct shows up often. It is far less often the thing that opened or closed the sale, which is why the gap is wide on first and last click and nearly gone here.
The Meta split does not close, though. Shopify still reports 1,660 organic against 160 paid. Misfiling is a property of classification, so it survives across models.
Any touch: which channels were involved at all
Channel | Type | Attryb | Shopify |
|---|---|---|---|
Direct | Unattributed | 3,870 | 3,560 |
Google Ads | Paid | 2,630 | 3,040 |
Google Search | Organic | 3,290 | 1,030 |
Meta Ads | Paid | 1,410 | 370 |
Meta organic | Organic | 1,950 | 3,070 |
Paid | 1,510 | 1,500 | |
Creator program | Partner | 420 | 180 |
Total |
| 15,080 | 12,750 |
Both totals are far above 6,360, and that is intentional. Any touch credits every channel present in a journey, so one order with four touchpoints produces four credits. It answers which channels were involved, not how many orders a channel produced.
The number to read is the average. Attryb sees 2.4 channels per order. Shopify sees 2.0.
Both systems are watching the same customers buy the same products. One can see about 20% more of each journey.
Attryb's Direct is higher here too, at 3,870 against 3,560, for the same reason as the linear table. More complete journeys mean more channels appear in each one, and Direct rises along with everything else.
The row that matters most is the total
Model | Attryb | Shopify |
|---|---|---|
First click | 6,360 | 6,780 |
Last click | 6,360 | 6,710 |
Last non-direct | 6,360 | 6,530 |
Linear | 6,360 | 6,780 |
Any touch | 15,080 | 12,750 |
The store had 6,360 attributable orders.
Attryb returns 6,360 under every model that assigns an order once. Any touch exceeds it deliberately and says so.
Shopify returns a different number each time, and none of them is 6,360.
That is not a small detail. If a channel report doesn't add up to what the business actually sold, you cannot tell whether a channel's number is high because the channel performed or because the counting leaked.
Where does each system stand?
Capability | Shopify | Attryb |
|---|---|---|
Sees every channel | Partly | Yes |
Classifies beyond the UTM tag | No | Yes |
Sessions with no channel | 63% (27% ex-Direct) | 24% (0.2% ex-Direct) |
Counts touches with no site visit | No | No |
Allocates each order exactly once | No | Yes |
Lookback | Fixed 30 days | Full journey, or matched |
Models | Five, on partial data | Five, on resolved data |
The second row explains Shopify's attribution: everything downstream of UTM classification inherits its errors, which is why five models can all be wrong about the same two-thirds of traffic.
The fifth row explains everyone else: five of six systems report numbers that were never required to tie to anything, and a number under no obligation to reconcile will drift toward whatever flatters the platform reporting it.
What Does the Accuracy Cost?
Everything above buys accuracy at a price. There are four prices, and a brand should know all of them before switching how it measures.
What MECE costs
Three real costs:
You have to pick a rule, and the data cannot pick it for you. First click and last click are both MECE, and they disagree, sometimes sharply. Nothing in the event stream says which is correct, because "which touch caused the purchase" is not a question observation can answer.
Any rule is a convention, not a causal claim. Assigning 100% of an order to its first touch does not mean the first touch caused the whole purchase. MECE makes the arithmetic honest. It does not make the allocation true.
It cannot express presence. Meta Ads appeared somewhere in 1,410 of this brand's 6,360 eligible orders, which is 22% of the book. That is a real and useful fact, and no MECE model can state it, because doing so would mean counting orders for which other channels have already been credited.
Why it still wins
The first two costs are answered by running several MECE models side by side rather than picking one and defending it. First click, last click, last non-direct, and linear each allocate every order exactly once, and each adds up to the total order count. The difference between them is where the multi-touch information lives: Google Ads, claiming 1,880 orders on the first click and 1,220 on last click, is a measure of assist behavior, recovered without breaking the arithmetic.
The third cost is answered by one deliberately non-MECE view. Any-touch credits every channel present anywhere in a journey, so an order with four touchpoints produces four credits. Its total always exceeds the order book, which is the point: it answers which channels were involved rather than how many orders a channel produced.
That distinction is the whole argument summarized: an overcount you selected, whose logic you understand and whose size you can compute, is a tool. The problem with platform numbers is not that they overcount. It is that they overcount without saying so, by an amount nobody can determine.
Every system in the rest of this piece either meets this standard or explains why it doesn't.
We exclude view-through, and that undercounts impression-led channels
There is a serious argument on the other side. Video advertising influences purchasing without producing a click. Someone watches a 15-second product video, doesn't tap through, searches for the brand 2 days later, and buys. Click-based attribution records that as organic search; the video gets nothing, and a brand scaling that logic across a channel cuts the budget and watches branded search decline a month later without knowing why. On that reasoning, a system structurally unable to see impression-driven demand will systematically defund the top of the funnel.
The argument is right about the phenomenon. Impressions influence purchases.
We still don't credit them, because an impression that leaves no trace on the store cannot be reconciled against anything - no session, no timestamp, no event. Crediting it means inserting a touchpoint based on an assumption, and the resulting number can never be checked by us or the brand. Every other figure in this piece traces to a specific event at a specific time in a specific order. Given a choice between undercounting verifiably and overcounting plausibly, we take the first.
What would change our mind: view-through credit validated against holdout tests at the brand level. Switch a view-only campaign off across a set of geographies, measure what happens to orders, compare against what the view-through model predicted. That experiment is runnable, and until a view-through number has been run through one, it remains an untested claim about causation.
We refuse probabilistic device joins, and that loses anonymous cross-device journeys
If someone browses anonymously on a phone and buys anonymously on a laptop, having never logged in, subscribed, or reused an email, no deterministic link exists between those devices. Some approaches bridge the gap probabilistically, matching on IP address, timing, and behavioral similarity. We don't, for the same reason as view-through: a probabilistic join produces a journey nobody can check, and it contaminates every number downstream without announcing itself. The cost is real, and it falls hardest on first-time buyers.
A residual always remains
The 2,330 unresolved sessions described earlier are not a temporary state that better engineering removes. Some visits genuinely arrive carrying no signal at all, and the honest ceiling on classification is high rather than total. In practice, this matters less than the number suggests, because those sessions are disproportionately first-ever visits that never convert. It matters more for a brand whose traffic skews toward stripped-down in-app browsers, where the residual runs above 0.2%.
The method improves with history, so new stores get less from it
Attribution is only as good as the journey data behind it. For a brand with journeys lasting more than 60 days, expect roughly 3 months of data collection before first-touch numbers stabilize. Three weeks in, a store gets a better channel report than Shopify's, and not yet a complete one, and last-click numbers will be trustworthy well before first-click ones are.
What Are Other Methods To Find True Attribution
Attribution answers which channels touched an order. It does not answer whether the order would have happened anyway, and no amount of resolution collapses those into one question.
Suppose we credit a retargeting ad with 400 orders. After the work described above, the claim that 400 buyers saw a retargeting ad before purchasing is well evidenced. What it does not establish is that a single one of those purchases required the ad. Retargeting mostly reaches people who have already decided. Attribution records the touch and credits it faithfully. The touch may have contributed nothing.
Three other methods answer questions attribution can't. Together, they make four tools with four different jobs, and a serious measurement stack runs more than one of them.
Incrementality testing switches a channel off for a randomly chosen set of geographies or users, holds everything else constant, and measures the difference in orders. Geo holdouts, conversion lift tests, and ghost-ad experiments are versions of this. It is the only method that establishes causation. It costs real revenue during the holdout period, takes weeks, and answers only one question per test.
Marketing mix modeling works at the aggregate level, using statistical methods to separate spend from seasonality and other external factors. It is the right tool for total budget allocation across large channels, particularly ones with no click at all - television, out-of-home, podcast. It needs years of history, and it cannot tell you anything about an individual order.
Post-purchase surveys ask the customer directly at checkout, "How did you hear about us?" This is the method most D2C brands reach for first, and it has one advantage nothing else here can match. It captures channels no tracking system can see - a friend's recommendation, a podcast mention, a store window - and it is the only method that reports on the customer's own perception of what influenced them. Its weaknesses are equally real: response rates are partial and skew toward certain buyer types, recall is unreliable for early touchpoints, the option list shapes the answer, and customers routinely credit the last thing they remember rather than the thing that introduced them. It works best as a cross-check on the channels that tracking undercounts, and worst as a primary allocation method.
Attribution, when done properly, runs daily, covers every order rather than a sample, and is the right tool for allocating across channels, campaigns, and creatives.
The useful division is by decision speed. Attribution runs daily and shapes the media mix. Incrementality runs quarterly on the questions worth an experiment. Mix modeling runs annually and shapes the total. Surveys run continuously as a sanity check on the channels the other three see least well.
What doesn't follow is the conclusion some people draw: that because attribution can't prove causation, the choice of attribution doesn't matter much. It matters a great deal. A resolved report is better than an unresolved one in the way a correct map is better than one with a third of the territory blank, and the fact that neither is the territory doesn't make them equivalent. Both are non-causal. Only one is also wrong about what happened.
5 Checks to Test Your Own Store’s Attribution Accuracy
One brand's data proves nothing about yours. These five checks are the same analysis reduced to things you can run this week without buying anything, so the argument is falsifiable against your numbers rather than only demonstrable against ours.
What share of your sessions has no channel?
In Shopify, go to Reports and run this query as a New Exploration:
Add Direct and Unknown, and divide by total sessions. This number governs everything else. Below 25%, your channel data is broadly sound; focus your attention elsewhere. Above 50% and no model you select will help, because most of your traffic is invisible to all of them.
How far apart are your platforms?
Take every tool that reports attributed orders or revenue, not just the ad platforms: Meta, Google, TikTok, your email and SMS platform, your affiliate or creator tool. Add their claimed orders for one period and compare against your actual order count. Under 10% usually means one dominant channel and little overlap. Over 40% is common at brands running five or more channels, and it means most of your reporting describes journeys that several tools are each claiming in full.
How much of Meta's number is view-through?
In Ads Manager, compare your default attribution setting against click-only. The difference is the share of your Meta reporting from people who never reached your site. Then divide Meta revenue by spend under both definitions and see how far your ROAS moves.
How long is your actual journey?
Pull your last few hundred orders and compare each customer's first recorded session date against the order date. Look at the median and the share beyond 30 days separately, because they answer different questions. A short median with a long tail is the pattern that breaks fixed-window reporting.
Does anything you report reconcile?
Take any attribution report you use for budget decisions and total the orders across all channels. Compare it to the orders placed in that period. If the report doesn't tell you whether those two figures are supposed to match, that is the finding.
Four of the five take under an hour.
The bottom line
The brand's platforms claimed 10,510.7 online orders. The store served 6,360.
None of those platforms is dishonest. Each answered its own question correctly, and each question was reasonable. What nobody running a business can do is act on five correct answers to five different questions, and the usual response of comparing dashboards, picking one to trust, and running the same partial data through a more sophisticated model produces a more confident version of the same picture.
Shopify should have been the answer. It owns the order book, sees every channel, captures an email address at checkout, and sells no media. What it doesn't have is a classification method that survives a missing UTM tag, and everything downstream inherits that.
The fix is to name the channel before modeling it, look across the whole journey rather than a fixed thirty days, credit only touches that actually happened, and allocate every order exactly once so the total ties to the ledger and someone can check.
Do that and the question the brand started with - which channel contributed what - has an answer, in the same units, that adds up.
Frequently Asked Questions
01
Does this replace attribution provided by Google Analytics?
02
We run TikTok, email marketing and a creator program. Does this cover them?
03
How long before the data is usable?
04
Why does any-touch exceed the number of orders?
05
Can Attryb’s attribution match Shopify's 30-day window so we can compare?
06