

Why does data matter in modern marketing?
Digital marketing runs on data now. Every click, impression, and purchase leaves a trail, and that trail tells you far more about your audience than any focus group ever could. Marketers today see click-through rates on social ads, watch customer journeys unfold in analytics tools, and track revenue down to the individual campaign.
Data alone doesn't win campaigns, though. You need a way to turn that data into decisions, and statistics gives you that bridge. Regression analysis in particular helps you sort real patterns from random noise, so you can adjust budgets, creative, and targeting with confidence instead of instinct.
This guide walks through how regression works, which metrics deserve your attention (including CAC, ROAS, and MER alongside the usual CTR and CVR), and how to fold conversion rate optimization into the same data-driven loop.
What role does statistics play in marketing performance?
Marketing success comes down to influencing behavior: getting the right message in front of the right person at the right time. Dozens of variables affect that outcome, including budget, creative quality, seasonality, audience makeup, and competitor move. Statistics gives you a structured way to make sense of all of it.
Statistics helps you spot which factors actually influence your results instead of just correlating with them by coincidence. It lets you quantify relationships, so you know that a dollar spent on one channel produces more revenue than a dollar spent on another. It supports forecasting, letting you project performance based on historical trends. And it validates your experiments, confirming that an A/B test result reflects a real effect rather than random variation.
Even simple statistical concepts, like average order value or the spread of your conversion rates across campaigns, give you a foundation. Regression builds directly on that foundation.
What is regression analysis and why does it matter to marketers?
Regression analysis stands out among statistical techniques because it directly connects marketing actions to marketing outcomes. In simple terms, regression shows how a change in one variable, like ad spend, relates to a change in another variable, like sales revenue.
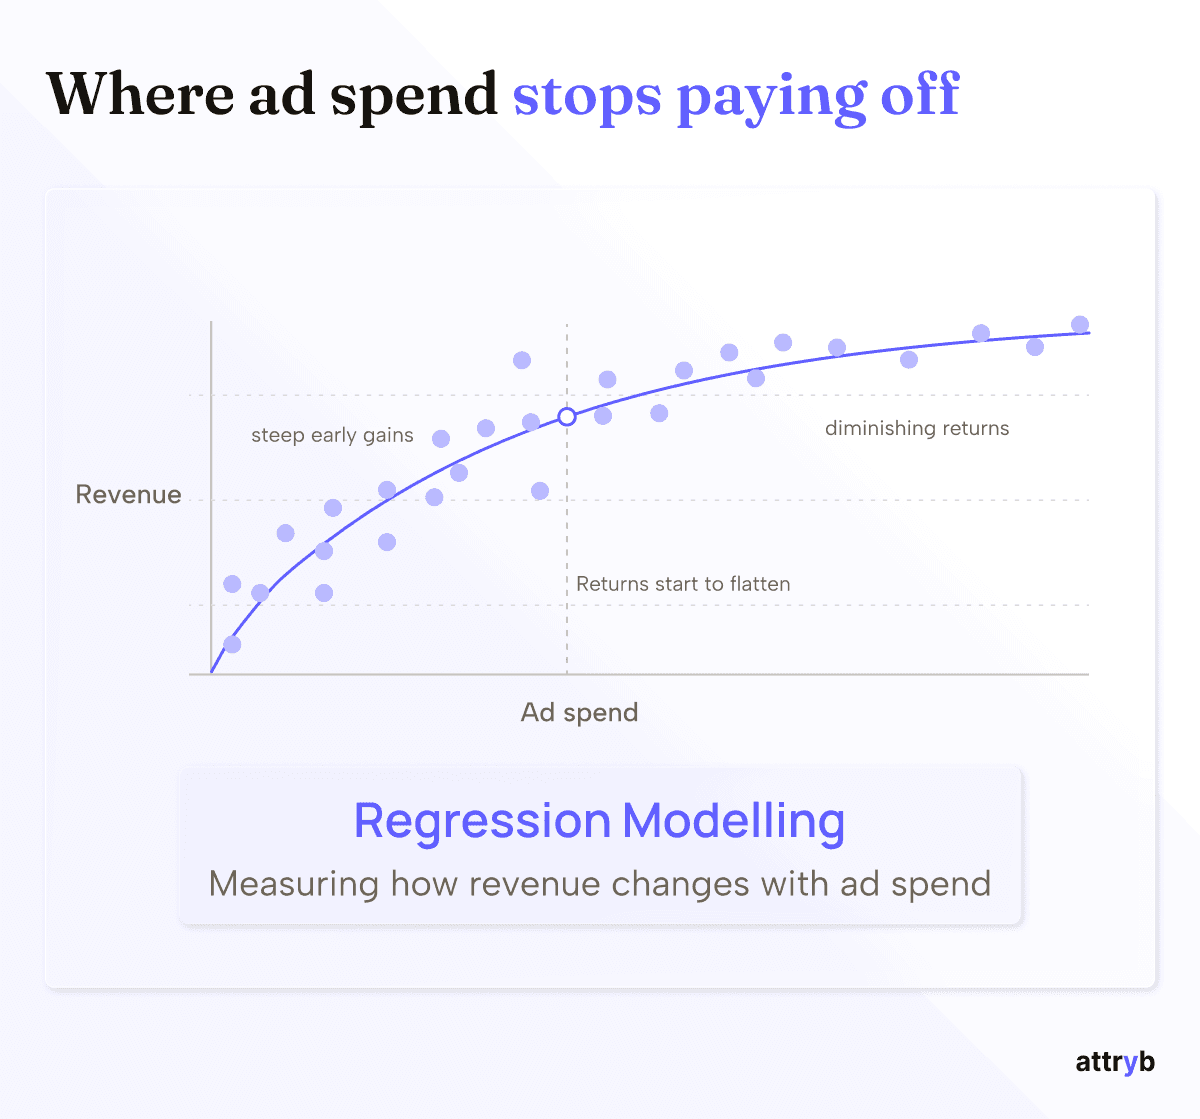
Figure 1. Graph of regression modelling between revenue and ad spend
What does regression actually measure?
Regression estimates the relationship between variables. A linear regression model, for example, fits a line that shows how a dependent variable, such as revenue, changes as an independent variable, such as ad spend, moves. Marketers usually start with linear regression because metrics like spend, clicks, and conversions behave as continuous numbers.
Why should marketers care about regression?
Regression tells you the size of each variable's impact on your target metric, not just whether a relationship exists. You can simulate scenarios: what happens to revenue if you raise your social budget by 10 percent, or if you redesign a landing page to lift CTR. More advanced regression models even reveal how relationships shift across customer segments, which sharpens your targeting.
Which metrics should you track for regression analysis?
Picking the right metrics matters as much as running the model correctly. Include too many variables and you risk overfitting the model to noise. Leave out the wrong ones and you miss the real story.
Ad spend measures the total budget you put behind a campaign or channel. Comparing spend against outcomes tells you whether you're hitting diminishing returns or whether more investment would still pay off. Click-through rate, or CTR, measures the ratio of clicks to impressions and signals how compelling your ad copy and targeting really are. Conversion rate, or CVR, tracks the share of clickers who complete a desired action, which reflects landing page quality and buyer intent. Demographic and behavioral data, like age, location, and RFM (recency, frequency, monetary) scores, show you which audience segments deserve more budget. External factors, including seasonality and competitor spend, round out the picture so your model isn't blind to the market around it.
Run a correlation check before you build your full regression model. It flags which variables have the strongest relationship with your goal metric, so you don't clutter the model with variables that add noise instead of insight.
Where do CAC, ROAS, and MER fit in?
CTR and CVR tell you whether people engage with your ads. CAC, ROAS, and MER tell you whether that engagement actually makes you money, which is why they belong in the same regression models.
CAC, or Customer Acquisition Cost, is the total spend required to gain one paying customer. You calculate it by dividing total acquisition spend by the number of new customers in a given period. Feed CAC into your regression model alongside channel spend and you can see which channels bring in customers cheaply and which ones are quietly draining your budget.
ROAS, or Return on Ad Spend, measures the revenue generated for every dollar spent on advertising. A campaign with a high CTR can still carry a weak ROAS if the traffic it drives doesn't convert into meaningful revenue, so tracking ROAS alongside CTR keeps your regression model honest about what actually pays off.
MER, or Marketing Efficiency Ratio, takes a wider view by dividing total revenue by total marketing spend across every channel combined. Where ROAS zooms in on individual campaigns, MER shows whether your overall marketing investment is efficient once you account for overlap between channels. Adding MER as a variable in a regression model helps you judge whether shifting budget between channels improves total efficiency or just moves the same result around.
Together, CAC, ROAS, and MER turn a regression model built only on clicks and conversions into one that reflects real profitability.
How can you apply regression to real marketing problems?
Regression isn't a theoretical exercise. It solves real problems for marketers. Three applications show where it delivers the clearest value.
How does regression help you find the right price?
Pricing decisions carry real risk. Price too high and you lose customers; price too low and you sacrifice margin. Regression helps you find the balance. Build a dataset of prices, or price tiers, alongside the sales volume and revenue each one produced over time. Run a regression model on that data and you can see exactly where a price increase starts producing diminishing returns, or where a small price cut might drive enough extra volume to lift total revenue. This works especially well for direct e-commerce sellers who can track historical pricing, discounts, and sales side by side.
How does regression reveal customer behavior patterns?
Regression also explains why customers buy the way they do. Feeding RFM metrics into a regression model highlights which segments purchase most often, spend the most per order, or return most reliably. Adding time-series data uncovers seasonality, showing you whether sales cluster around holidays or specific promotions. And testing demographic or behavioral variables against conversion rate, average order value, or NPS shows you which segments actually drive your best outcomes, so you can match spend and messaging to real behavior instead of assumptions.
How does regression measure marketing effectiveness across channels?
When you run campaigns across social, paid search, email, and influencer partnerships at once, isolating what's actually driving conversions gets hard. A regression model that includes spend or impressions by channel shows you which one produces the biggest incremental lift in sales, which helps you rebalance your marketing mix toward the channels earning their keep. You can also fold creative variables, like format, messaging angle, or call-to-action style, into the same model to see which creative choices statistically move CTR or CVR. Larger advertisers extend this into full marketing mix modeling, which captures spend across every channel plus external factor like seasonality and broader economic trends.
What are the steps to run a regression analysis for your campaigns?
Start by collecting your historical campaign data: budgets, impressions, clicks, conversions, revenue, and audience details. Clean it thoroughly, since duplicate records, missing values, and data-entry errors will distort your results no matter how good your model is.
Next, explore the data before you model it. Descriptive statistics and simple visualizations, like scatter plots and histograms, reveal obvious patterns and outliers early. This step also flags multicollinearity, which happens when two variables move together so closely that the model can't tell their effects apart, like nearly identical spend across Google Ads and Facebook Ads.
Then choose your tool. Excel handles simpler regression tasks well, especially if coding isn't part of your workflow. For more advanced needs, like stepwise regression or logistic regression for yes-or-no outcomes, R, Python, or SPSS give you more flexibility.
After that, build the model itself. Pick your dependent variable, usually revenue or total conversions, and choose your independent variables from the metrics you've already gathered, including CAC, ROAS, and CTR. Aim for at least 10 to 15 data points per variable so the model doesn't overfit to a small sample.
Once the model runs, interpret the output carefully. The coefficient shows how much your dependent variable shifts for each unit change in an independent variable. The p-value tells you whether that relationship is statistically meaningful, with values under 0.05 generally considered significant. R-squared shows how much of the variation in your outcome the model actually explains, though a very high R-squared paired with many variables can signal overfitting rather than a strong model.
Finally, act on what you find. Shift spend toward channels with strong, significant coefficients. Adjust targeting or messaging where certain audience traits correlate with conversions. Then validate those changes with smaller-scale tests before rolling them out fully and repeat the whole process as new data comes in, since market conditions and customer behavior keep shifting underneath you.
How does regression support market segmentation and targeting?
Segmentation groups your audience by shared needs or behaviors, and regression sharpens how you build and use those groups. Including variables like average order value, lifetime value, or churn rate in a regression model pinpoints which segments drive the most profit or loyalty. Mapping how each segment moves through your funnel, from first ad view to final purchase, shows which combination of touchpoints converts best for that group.
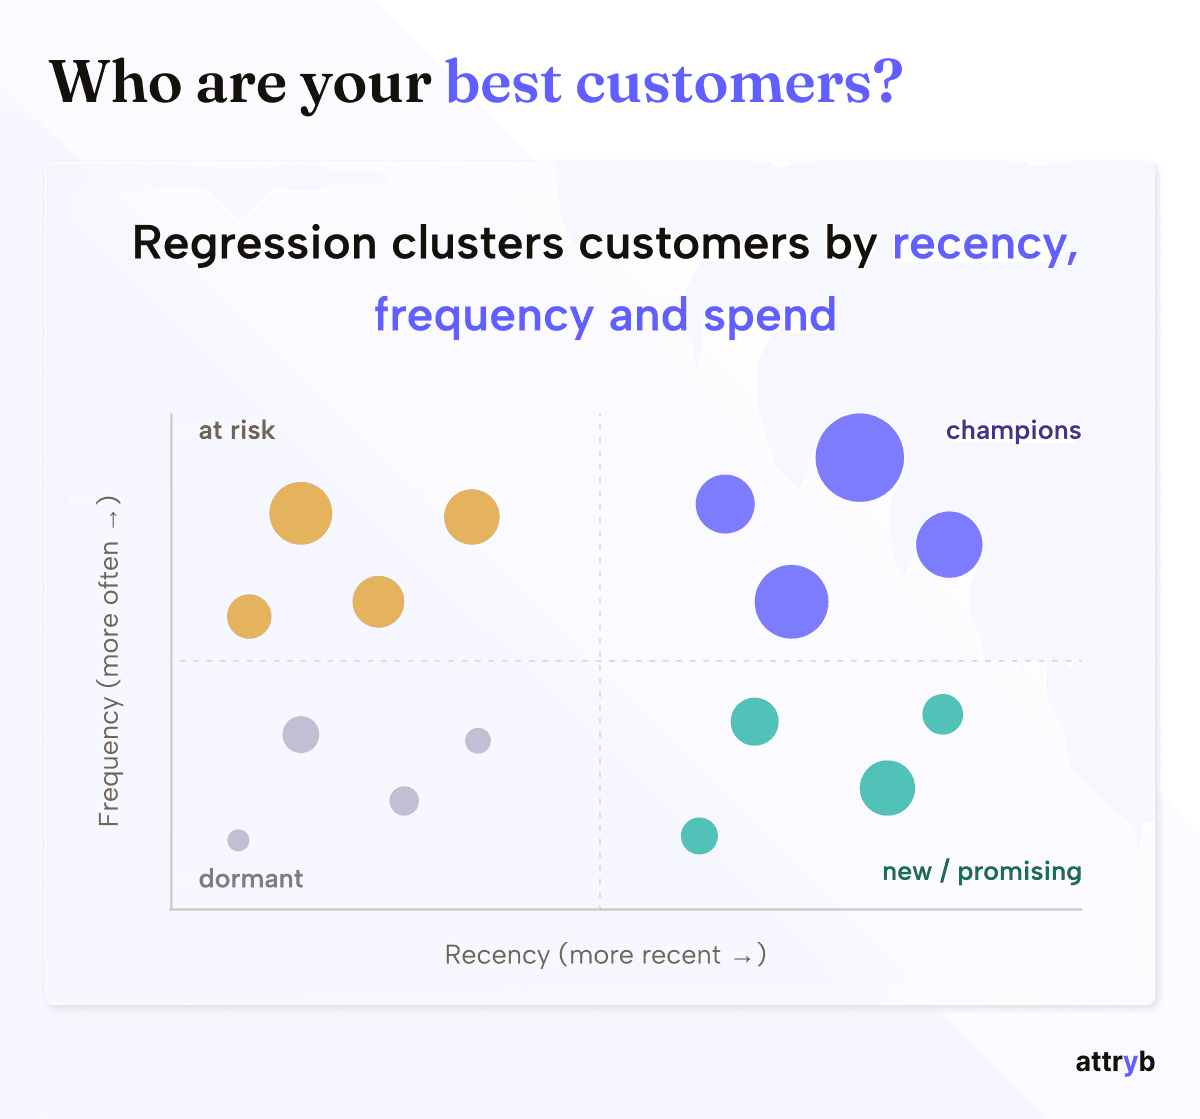
Figure 2. Finding your best customers by RFM regression modelling
The payoff shows up in how you allocate budget. If regression shows younger customers responding to influencer content while older customers respond to email, you can shift spend and messaging to match, rather than running one generic campaign across every segment.
How does conversion rate optimization (CRO) complete the picture?
Regression tells you where your best opportunities sit. Conversion rate optimization, or CRO, is how you actually capture them. CRO covers the ongoing process of testing and refining landing pages, checkout flows, and calls to action so a larger share of your existing traffic converts, without spending an extra dollar on acquisition.
The two practices work together directly. If your regression model shows that CVR is the weakest link between clicks and revenue for a given channel, that's your signal to prioritize CRO work there, whether that means simplifying a checkout form, rewriting a headline, or testing a new page layout. Run those CRO tests as controlled experiments, since regression reveals correlation, but a proper A/B test confirms that your change actually caused the lift. Once a CRO win raises CVR, feed the updated numbers back into your regression model. Rising CVR should show up as improved ROAS and a lower CAC, closing the loop between analysis and action.
What common challenges should you watch for in regression analysis?
Overfitting happens when a model fits historical noise so closely that it performs poorly on new data. Limiting the number of variables and validating the model against fresh data both help prevent it. Multicollinearity, where two variables move almost identically, makes it hard to isolate either one's real effect and can distort your coefficients; combining or removing correlated variables, or checking the variance inflation factor, keeps this in check.
Data quality issues, like missing records or unnoticed outliers, skew results before the model even runs, so rigorous cleaning matters more than any modeling technique. Ignoring external factors, such as competitor pricing or broader economic shifts, leaves gaps that make your model miss real drivers of performance. And correlation is not causation: a variable can move alongside your revenue without actually causing the change, so pair your regression findings with controlled A/B tests before you commit real budget to a conclusion.
Turning numbers into marketing decisions
Regression analysis and the metrics around it, from CTR and CVR to CAC, ROAS, and MER, do more than describe your past campaigns. They point you toward what to do next. Use regression to find your highest-impact levers, track CAC, ROAS, and MER to confirm those levers actually pay off, and lean on CRO to capture the gains regression uncovers.
None of this replaces good judgment or careful data collection. Clean data, thoughtfully chosen variables, and a willingness to validate findings with real experiments will always matter more than the sophistication of any single model. Treat regression as one part of an ongoing, iterative process, and your campaigns will keep improving with every cycle instead of repeating the same guesses.
Frequently asked questions
01
What is regression analysis in simple terms?
02
What's the difference between CAC and ROAS?
03
How is MER different from ROAS?
04
Why does conversion rate optimization matter if regression already shows what's working?
05
How much data do I need before running a regression model?
06
Can I run a marketing regression analysis in Excel?
07
What does a p-value tell me in a marketing regression model?
08
What is multicollinearity and why should marketers care?
09
Does a high R-squared always mean a good model?
10
Can regression prove that a marketing channel caused an increase in sales?
11
Which should I improve first, CAC or CRO?
12